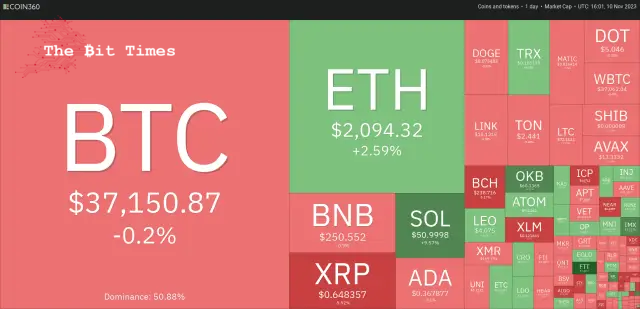
Latest Market Overview 10th Nov: BTC, ETH, BNB, XRP, SOL, ADA, DOGE, TON, LINK, MATIC

Bitcoin and Ether remain prominent leaders in the cryptocurrency markets, but there is a potential for a short-term decline.
The news about BlackRock registering the iShares Ethereum Trust has raised expectations that the asset manager might eventually seek approval for an exchange-traded fund (ETF) focused on Ethereum (ETH). This positive development indicates that BlackRock’s interest in cryptocurrencies extends beyond Bitcoin (BTC).
Market observers are becoming increasingly hopeful about the approval of spot Bitcoin ETFs by the United States Securities and Exchange Commission in 2024. James Seyffart, a research analyst at Bloomberg Intelligence, expressed optimism on X (formerly Twitter), suggesting there is still a 90% chance that the regulator will approve a spot Bitcoin ETF by Jan. 10 of the following year.
Galaxy Digital founder Mike Novogratz believes that the approval of the Bitcoin ETF, followed by the Ether ETF, will boost institutional adoption in 2024. During Galaxy Digital’s third-quarter earnings call on Nov. 9, Novogratz exhibited confidence that approval for ETFs “is now not a matter of if but when.”
Could the expectations regarding ETF approvals sustain the rally in Bitcoin and select altcoins, or will profit-booking set in?
Let’s analyse the charts of the top 10 cryptocurrencies to find out.
Bitcoin (BTC) price analysis
Bitcoin shot above the ascending channel pattern on Nov. 9, but the higher levels witnessed profit-booking from the long wick on the candlestick.
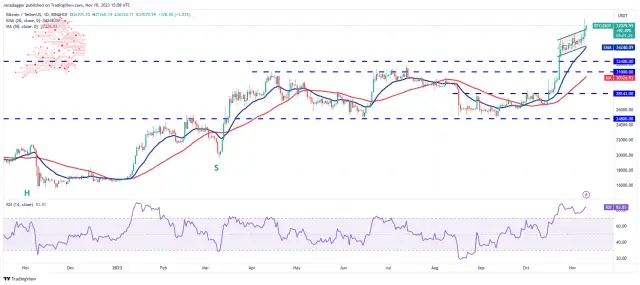
The relative strength index (RSI) has been trading in the overbought territory for several days, indicating that the bulls have maintained the buying pressure. If the current rebound sustains, the buyers will try to propel the BTC/USDT pair to $40,000 again.
On the contrary, if the price dips back into the channel, it will indicate that markets have rejected the higher levels. That could pull the price down to the 20-day exponential moving average ($34,240), a significant level to watch out for. A break below this level will tilt the short-term advantage in favour of the Bears.
Ether (ETH) price analysis
Ether skyrocketed above the psychological resistance of $2,000 on Nov. 9, indicating aggressive buying by the bulls.
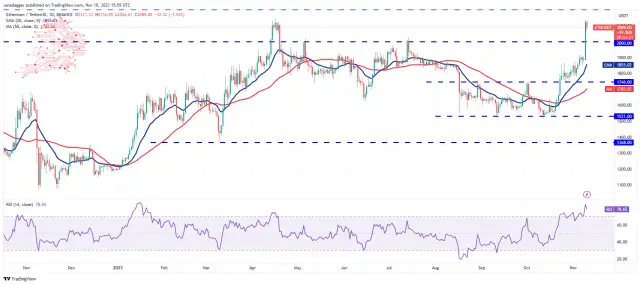
The recent rally has propelled the RSI into the overbought territory, suggesting a consolidation or correction may be around the corner. Sellers will try to halt the up-move at $2,200, but they will have to yank the price back below $2,000 if they want to weaken the momentum.
Contrarily, if the ETH/USDT pair surges above $2,200, it will open the doors for a potential rise to $2,950, as there is no significant resistance in between.
BNB price analysis
The bulls purchased the dip in BNB on Nov. 9, indicating that the lower levels continue attracting buyers.
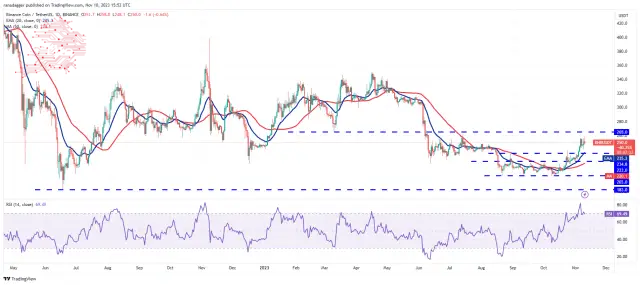
The bulls will try to drive the price above the overhead resistance at $265. If they can pull it off, the BNB/USDT pair could rise to $285 and attempt a rally to $310 afterwards. This level is likely to pose a strong challenge for the bulls.
The crucial support on the downside is the 20-day EMA ($235). Sellers must tug the price below this level to gain the upper hand. The pair could then collapse to the 50-day SMA ($220).
XRP price analysis
XRP turned down from $0.74 on Nov. 6 and broke below the immediate support at $0.67 on Nov. 9. This suggests profit-booking by the bulls.
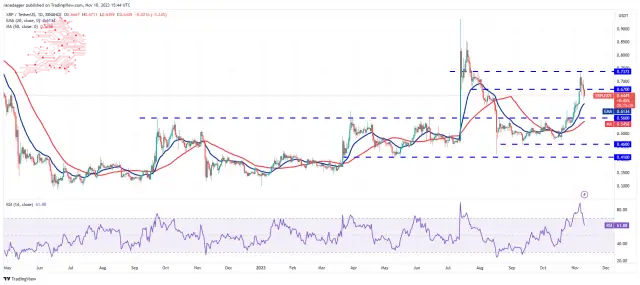
The rising 20-day EMA ($0.61) and the RSI in the positive territory indicate that the bulls have the upper hand.
If the price returns from the 20-day EMA, it will suggest that the sentiment remains bullish, and traders view the dips as a buying opportunity. That improves the prospects of a break above $0.74. The XRP/USDT pair could then climb to $0.85.
Contrary to this assumption, a break below the 20-day EMA could deepen the correction to the next support at $0.56.
Solana (SOL) price analysis
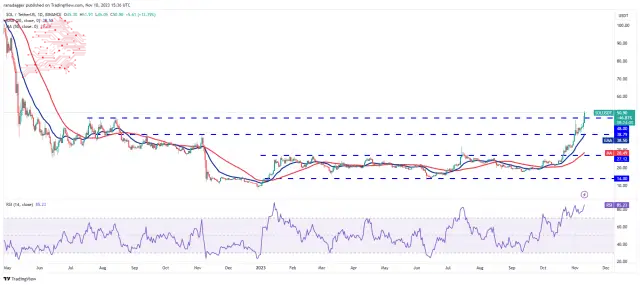
If the SOL/USDT pair maintains above $48, it will signal the start of the next leg of the uptrend. The pair may then ascend to $60.
The risk of the up-move is from the overbought level on the RSI. This suggests that the rally is overextended in the near term and ripe for a correction or consolidation. The longer the price remains in the overbought territory, the greater the possibility of a sharp pullback. A slump below $48 will be the first sign that the bulls may lose their grip.
Cardano (ADA) price analysis
Cardano pierced the overhead resistance at $0.38 on Nov. 9, but the long wick on the candlestick shows that the markets rejected the higher levels.
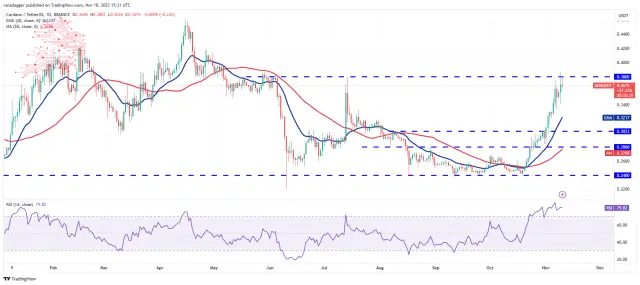
The bulls will again try to shove and sustain the price above the overhead resistance. If they are successful, the ADA/USDT pair could jump to $0.42 and subsequently to $0.46. Buyers may face a formidable resistance at $0.46.
Alternatively, if the price turns from $0.38, it could slide to the 20-day EMA ($0.32). This remains the critical level to watch for on the downside. A strong rebound off it could keep the advantage with the buyers, while a break below it may indicate a range-bound action in the near term.
Dogecoin (DOGE) price analysis
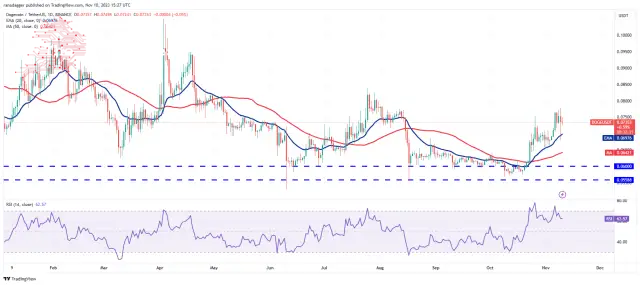
A minor positive is that the bulls have not ceded much ground to the bears. This suggests that the bulls expect the recovery to continue. There is a stiff hurdle at $0.08, but if that is crossed, the DOGE/USDT pair may reach $0.10.
Bears must pull the price back below the 20-day EMA ($0.07) if they want to make a comeback. The breakdown will suggest that the pair may consolidate inside an extensive range between $0.08 and $0.06 for some time.
Toncoin (TON) price analysis
Toncoin (TON) closed above $2.59 on Nov. 8, but the bulls could not maintain the higher levels. The price dropped sharply and slipped below $2.59 on Nov. 9.
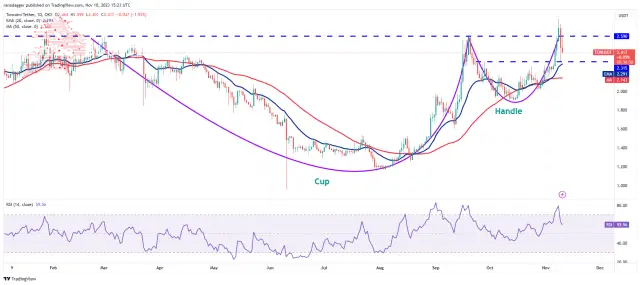
A slight advantage in favour of the bulls is that the 20-day EMA ($2.29) support is held on the downside. The bulls will again try to propel the price above the overhead resistance zone between $2.59 and $2.77. If they manage to do that, the TON/USDT pair could pick up momentum and travel toward the pattern target of $4.03.
This bullish view will be invalidated soon if the price continues lower and breaks below the 20-day EMA. The pair may then slump to $2.
Chainlink (LINK) price analysis
Chainlink reached $15 on Nov. 8, and the bulls tried to extend the rally on Nov. 9, but the long wick on the candlestick shows selling at higher levels.
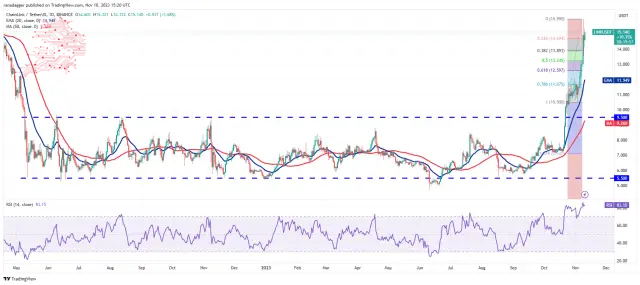
The LINK/USDT pair could slide to the 50% Fibonacci retracement level of $13.24. If the price rebounds off this level with force, the bulls will again try to overcome the obstacle at $15. If they succeed, the pair may surge to $18.
On the downside, if the price tumbles below $13.24, it will suggest that the traders are rushing to the exit. That could open the doors for a decline to the 20-day EMA ($11.94). This level is again expected to witness a tough battle between the bulls and the bears.
Polygon (MATIC) price analysis
Polygon’s rally picked pace after it broke above $0.70, but the up-move is facing selling near the overhead resistance at $0.89.
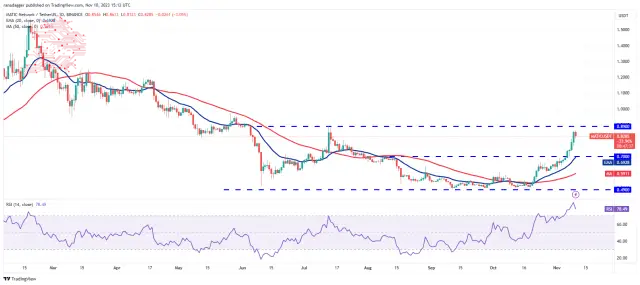
The price could dip to the 38.2% Fibonacci retracement level of $0.76. If the price rebounds off this level, it will enhance the prospects of a rally above $0.89. If that happens, the MATIC/USDT pair will complete a double-bottom pattern. This bullish setup has a target objective of $1.29.
Conversely, if the price breaks below $0.76, the next stop could be $0.70. Such a deep correction will suggest that the pair may continue oscillating inside the extensive range between $0.49 and $0.89 for a while longer.

Comments
Post a Comment